Are you a .NET developer seeking to enhance your logging capabilities? Look no further! In this comprehensive guide, we delve into the world of Serilog, the powerful logging framework for .NET applications.

Whether you’re a beginner or an experienced developer, this article will provide you with invaluable insights and practical tips to master Serilog and take your logging to the next level.
What is Serilog?
Serilog is a popular open-source logging library for .NET applications. It provides a flexible and powerful framework for capturing log events and storing them for analysis and troubleshooting purposes.

Serilog focuses on structured logging, which means that log events are written in a structured format that includes contextual information and properties associated with each event.
Why Use Serilog for logging?
There are several compelling reasons why you should consider using Serilog for logging in to your .NET applications.
- Simplified Syntax: Serilog offers a clean and expressive syntax for logging, making it easy to write and read log statements. Its fluent API allows you to construct log events with structured data, making them more meaningful and easier to analyze.
- Structured Logging: Serilog excels in structured logging, which means you can log data in a structured format, such as JSON or key-value pairs. This approach enables better analysis, querying, and filtering of log data, making troubleshooting and debugging more efficient.
- Extensive Integration: Serilog seamlessly integrates with various logging sinks and third-party extensions, allowing you to send logs to different output targets, such as files, databases, log servers, or cloud-based services like Elasticsearch or Seq.
- Enrichment and Contextual Information: Serilog provides powerful enrichment capabilities, enabling you to add contextual information to your log events dynamically. This can include timestamps, machine or user-specific details, correlation IDs, or any other relevant contextual data.
- Configurability: Serilog offers extensive configuration options, allowing you to tailor the logging behavior according to your specific requirements. You can configure log levels, sink options, formatting, filtering, and other parameters to achieve the desired logging output and optimize performance.
- Performance and Scalability: Serilog is designed for performance and scalability, making it suitable for high-volume logging scenarios. It incorporates efficient techniques for log event handling and batching, minimizing the impact on application performance while still providing comprehensive logging capabilities.
- Active Community and Support: Serilog benefits from an active and vibrant community of developers, with regular updates, bug fixes, and new features being contributed.
- Seamless Transition and Compatibility: If you’re already using another logging framework, Serilog provides smooth integration and compatibility options. You can leverage existing loggers or bridges to migrate gradually without disrupting your codebase.
- Open Source and Cost-Effective: Serilog is an open-source logging framework, which means it is freely available and may be customized and extended to meet your needs.
Logging Basics
Logging is a fundamental aspect of software development and involves capturing relevant information about the execution of an application. Logging allows developers to track the flow of the program, monitor its behavior, and troubleshoot issues.
Logging Events and Messages
When logging events and messages, developers capture relevant information about the execution of their application. Each log event typically consists of a log message and associated properties that provide context.
The log message describes what happened during the application’s execution, while the properties provide additional details.
Log.Information("User {Username} successfully logged in.", username);
In this example, the log message is “User {Username} successfully logged in,” and the property {Username} is replaced with the actual value of the username variable.
Log Levels and Their Significance
Log levels categorize the severity or importance of log events. They help differentiate between different types of log messages based on their significance. Common log levels include:
- Debug: Detailed information useful for debugging purposes. Typically not enabled in production environments.
- Information (Info): General information about the application’s execution. Useful for tracking the flow of the application.
- Warning: Indications of potential issues or unexpected behavior that don’t prevent the application from functioning.
- Error: Errors that occurred during the execution but were handled by the application. They signify a problem but do not cause the application to crash.
- Fatal/Critical: Severe errors that cause the application to terminate or become unusable. These errors indicate critical failures.
Structured Logging with Serilog
Structured logging allows developers to capture log events in a structured format using key-value pairs or custom objects. Serilog supports structured logging, making it easier to analyze and search log data efficiently.
Log.Information("Order {OrderId} placed by {Username}.", orderId, username);
In this example, the log message contains placeholders for the OrderId and Username properties. The properties are passed as additional arguments to the logging method. By structuring log messages, it becomes easier to extract and analyze specific information from the logs.
Additionally, Serilog provides enrichers that automatically add context to log events. These enrichers capture information such as timestamps, machine names, process IDs, and more, enhancing the log data with additional context.
Setting Up Serilog in a .NET Application
Certainly! Now that we have gained a good understanding of Serilog, let’s move on to the practical side and learn how to install and configure Serilog in our .NET Core application.
Step 1: Create a .NET 6 Project
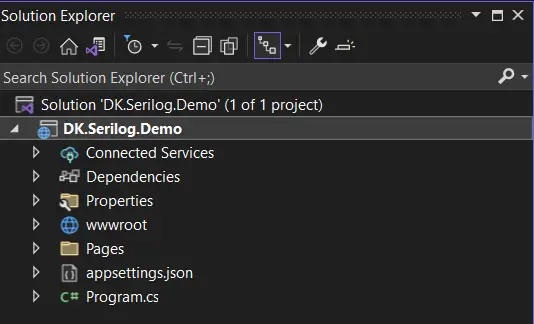
Start by creating a new .NET 6 project in your preferred development environment, such as Visual Studio or Visual Studio Code. I will be using Visual Studio 2022 for this demo.
Step 2: Add Serilog NuGet Package
In your project, right-click on the solution in the Solution Explorer and select “Manage NuGet Packages.” Search for “Serilog” and select the Serilog package that suits your requirements (e.g., Serilog, Serilog.Sinks.Console, Serilog.Sinks.File, etc.). Click on the “Install” button to add the package to your project.

As we see in the above image. I have installed the Serilog and Serlog.Sinks.Console Nuget packages into the application. Which will fulfill the basic requirement of logging data on the console.
Step 3: Configure Serilog in Program.cs
Open the Program.cs file in your project. Locate the CreateHostBuilder method. Add the following code snippet to configure Serilog:
using Serilog;
Log.Logger = new LoggerConfiguration()
    .MinimumLevel.Debug()
    .WriteTo.Console()
    .CreateLogger();
var builder = WebApplication.CreateBuilder(args);
// Add services to the container.
builder.Services.AddRazorPages();
var app = builder.Build();
// Configure the HTTP request pipeline.
if (!app.Environment.IsDevelopment())
{
    app.UseExceptionHandler("/Error");
    // The default HSTS value is 30 days. You may want to change this for production scenarios, see https://aka.ms/aspnetcore-hsts.
    app.UseHsts();
}
app.UseHttpsRedirection();
app.UseStaticFiles();
app.UseRouting();
app.UseAuthorization();
app.MapRazorPages();
try
{
    Log.Information("Starting up...");
    app.Run();
}
catch (Exception ex)
{
    Log.Fatal(ex, "Application start-up failed!");
}
This configuration sets the minimum log level to Debug and configures the console log sink.
Step 4: Customize Serilog Configuration
You can further customize Serilog’s configuration based on your specific needs. For example, you can add additional sinks (e.g., databases, cloud-based services) or enrichers to include contextual information in log events.
Step 5: Start Logging
Now that Serilog is configured, you can start logging in to your application using Log.Information, Log.Debug, Log.Error, etc.
Since I am using RazorApp. Let’s navigate to the HomePage model to add some logging.
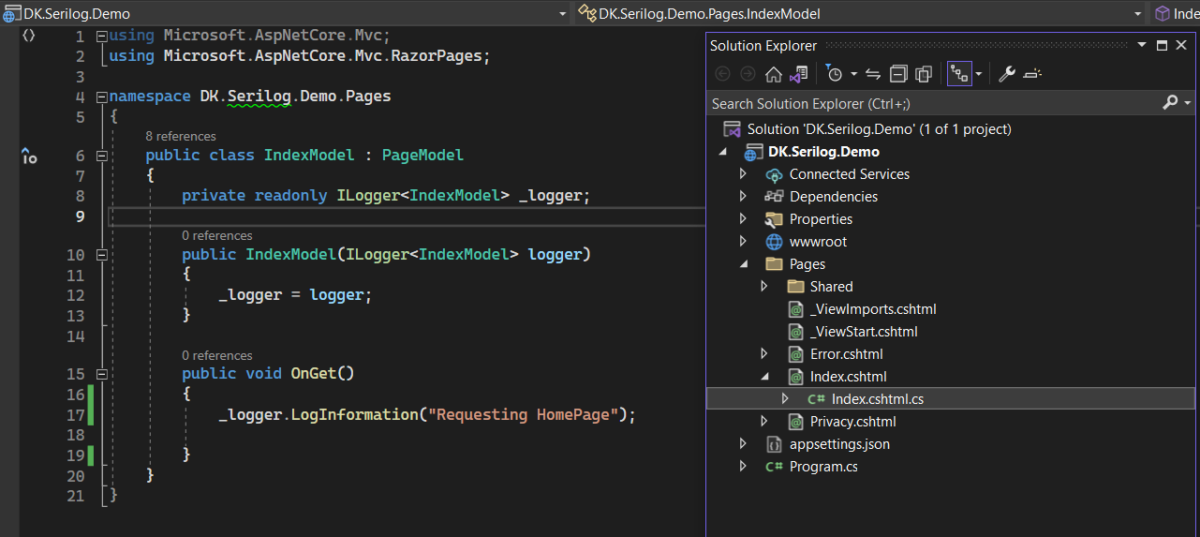
We have logged the information inside the OnGet method. “Requesting HomePage”. Which must load into the console when we run the application.
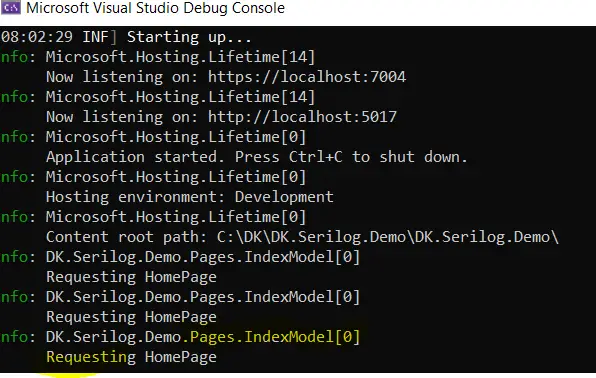
So, we are done with the installation and configuration of Serilogs in our demo application, Dk.Serlog.Demo. We could also see the output in the console.
Now lets deep dive into, how we can extend this functionality to achieve the further requirements of my application.
Configuration and Formatting
In Serilog we can add the configuration by code and also from the json file or application settings file in the case of a .Net Core application.
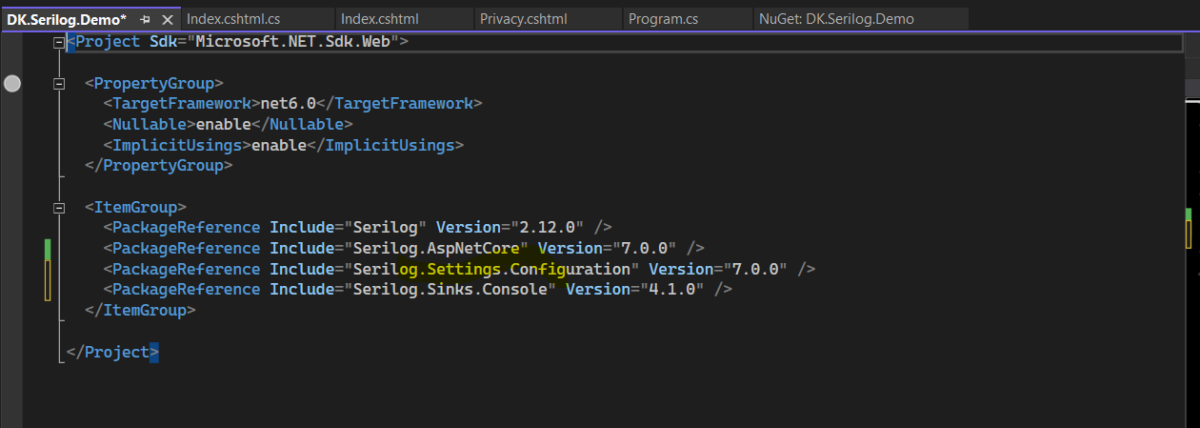
To read configurations from the appsettings.json file in a .NET application using Serilog, you can utilize the Serilog.Settings.Configuration package. Here’s an example of how to read configurations from the appsettings.json file.
Required Nuget Packages
- Serilog.Settings.Configuration
- Microsoft.Extensions.Configuration.Json
After installing both packages, our project file should look like this.
{
 "Serilog": {
    "MinimumLevel": {
      "Default": "Information",
      "Override": {
        "Microsoft": "Warning",
        "System": "Warning"
      }
    },
    "WriteTo": [
      {
        "Name": "Console"
      }
    ]
  }
}
This configuration specifies the logging behavior for Serilog. Here’s a breakdown of the different sections and their meanings.
Serilog: The root section that encapsulates all Serilog configuration settings.MinimumLevel: Specifies the minimum log level for capturing log events. It has two properties:Default: Sets the default minimum log level for all log events. In this example, it is set to “Information”, meaning log events with Information level and higher will be captured.Override: Allows you to override the minimum log level for specific namespaces or log sources. In this example, the log level for the “Microsoft” and “System” namespaces is set to “Warning”. This means that log events from these namespaces with a Warning level or higher will be captured, overriding the default minimum level.
WriteTo: Specifies the sink(s) where the log events will be written. In this example, it configures the logs to be written to the console. It has the following properties:Name: Specifies the name of the sink. In this case, it is set to “Console”, indicating that the logs will be written to the console output.
This configuration sets the minimum log level to “Information” by default but overrides it to “Warning” for the “Microsoft” and “System” namespaces. It also directs the logs to be written to the console sink.
You can further customize this configuration to include additional sinks, such as writing to a file, a database, or a log aggregation service. You can also adjust the minimum log level and overrides based on your specific logging requirements.
Remember to ensure that the necessary Serilog packages are installed and referenced in your project for the configuration to take effect.
Different Serilog Log Levels
To set up log levels in Serilog, you can configure the minimum log level for your logger. Here’s an example of how to set up log levels using Serilog in a .NET application.

In order to filter the logs we can utilize the Log levels to cut down the logs to specific types or levels based on the requirement.
Let’s check to see that Serilog is the only log provider registered and that all others have been removed.
using DK.Serilog.Demo.Services;
using Serilog;
IConfiguration configuration = new ConfigurationBuilder()
    .AddJsonFile("appsettings.json")
    .Build();
var logger= new LoggerConfiguration()
    .ReadFrom.Configuration(configuration)
    .CreateLogger();
var builder = WebApplication.CreateBuilder(args);
// Add services to the container.
builder.Services.AddRazorPages();
builder.Services.AddScoped<IEmployeeManager, EmployeeManager>();
builder.Logging.ClearProviders();
builder.Logging.AddSerilog(logger);
var app = builder.Build();
// Configure the HTTP request pipeline.
if (!app.Environment.IsDevelopment())
{
    app.UseExceptionHandler("/Error");
    // The default HSTS value is 30 days. You may want to change this for production scenarios, see https://aka.ms/aspnetcore-hsts.
    app.UseHsts();
}
app.UseHttpsRedirection();
app.UseStaticFiles();
app.UseRouting();
app.UseAuthorization();
app.MapRazorPages();
try
{
    Log.Information("Starting up...");
    app.Run();
}
catch (Exception ex)
{
    Log.Fatal(ex, "Application start-up failed!");
}
as per the above code builder.Logging.ClearProviders() will remove all the filter providers and the next line of code which is a builder.Logging.AddSerilog(logger) is to register the Serilog provider.
And, as we have seen in the other example above. We have logged all the information in the Razor page model. Which will be used to demonstrate the different log levels.
using Microsoft.AspNetCore.Mvc.RazorPages;

namespace DK.Serilog.Demo.Pages
{
    public class IndexModel : PageModel
    {
        private readonly ILogger<PageModel> _logger;

        public IndexModel(ILogger<PageModel> logger)
        {
            _logger = logger;
        }

        public void OnGet()
        {
            _logger.LogInformation("Information being logged");
            _logger.LogDebug("Debug being logged");
            _logger.LogError("Error being logged");
            _logger.LogWarning("Warning being logged");
            _logger.LogTrace("Trace being logged");
            _logger.LogCritical("Critical Information being logged");
        }
    }
}
LogLevel at Error
With this configuration, only log events with a level of Error or higher will be captured and displayed. Log events with lower severity levels, such as Information, Warning, or, will not be captured.
{
  "AllowedHosts": "*",
  "Serilog": {
    "MinimumLevel": {
      "Default": "Error"
    },
    "WriteTo": [
      {
        "Name": "Console"

      }
    ]
  }

}
Run the application and check the output on the console after making changes to appsettings.json. As shown in the picture below. Only errors that are critical, like Error and FTL, are displayed.

LogLevel at Warning
With this configuration, only log events with a level of Warning or higher will be captured and displayed in the console output. Log events with lower severity levels, such as Information, Debug, or, will not be captured.
{
  "AllowedHosts": "*",
  "Serilog": {
    "MinimumLevel": {
      "Default": "Warning"
    },
    "WriteTo": [
      {
        "Name": "Console"

      }
    ]
  }

}
Run the application and check the output on the console after making changes to appsettings.json. As shown in the picture below. Only errors that are critical, like Error and FTL, are displayed.

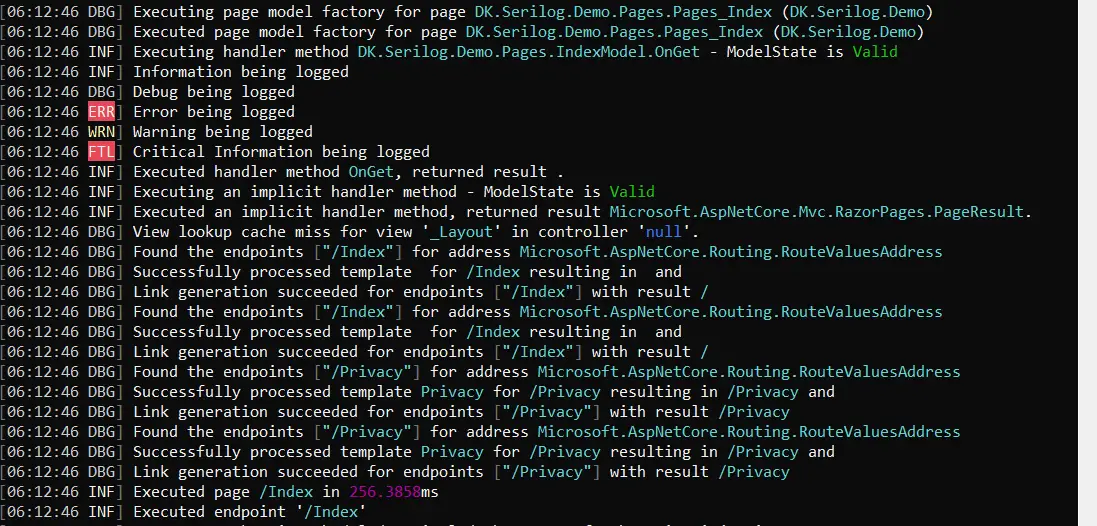
LogLevel at Debug
The Debug log level is the lowest level and is often used for detailed information during development or troubleshooting. It includes verbose messages that help developers understand the internal workings of the application. This level may contain sensitive information or excessive details that are typically not suitable for production environments.
{
  "Serilog": {
    "MinimumLevel": {
      "Default": "Debug"
    },
    "WriteTo": [
      {
        "Name": "Console"
      }
    ]
  },
  "AllowedHosts": "*"
}
When the log level is set to Debug, all log events with the levels Debug, Information, Warning, Error, and Fatal will be captured and displayed. This provides comprehensive information for debugging, tracing application flows, and diagnosing issues during development or troubleshooting scenarios.
LogLevel at Information
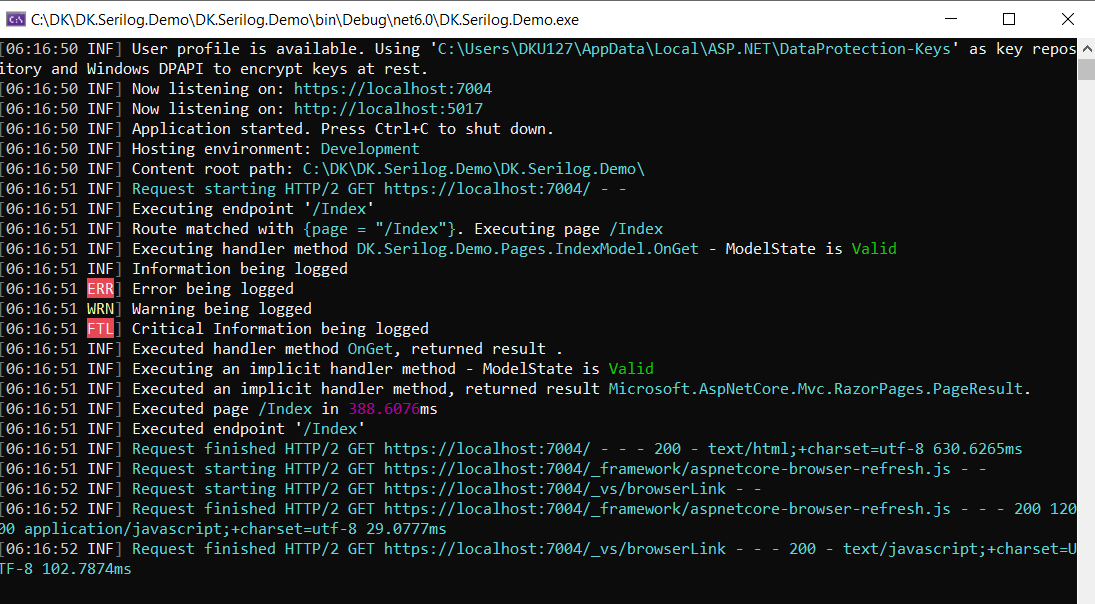
When the log level is set to Information, all log events with the levels Information, Warning, Error, and Fatal will be captured and displayed. This allows you to have a broader view of the application’s operational flow, track important events, and identify potential issues or errors.
{
  "AllowedHosts": "*",
  "Serilog": {
    "MinimumLevel": {
      "Default": "Information"
    },
    "WriteTo": [
      {
        "Name": "Console"

      }
    ]
  }

}
As we see in the output window. All the logs are shown except the Debug information.
LogLevel at Verbose
In Serilog, when the “Verbose” level is used, it typically indicates the highest level of detail or verbosity in the log messages. However, it’s important to note that the term “Verbose” is not commonly used in Serilog’s log-level hierarchy.
{
  "AllowedHosts": "*",
  "Serilog": {
    "MinimumLevel": {
      "Default": "Verbose"
    },
    "WriteTo": [
      {
        "Name": "Console"

      }
    ]
  }

}
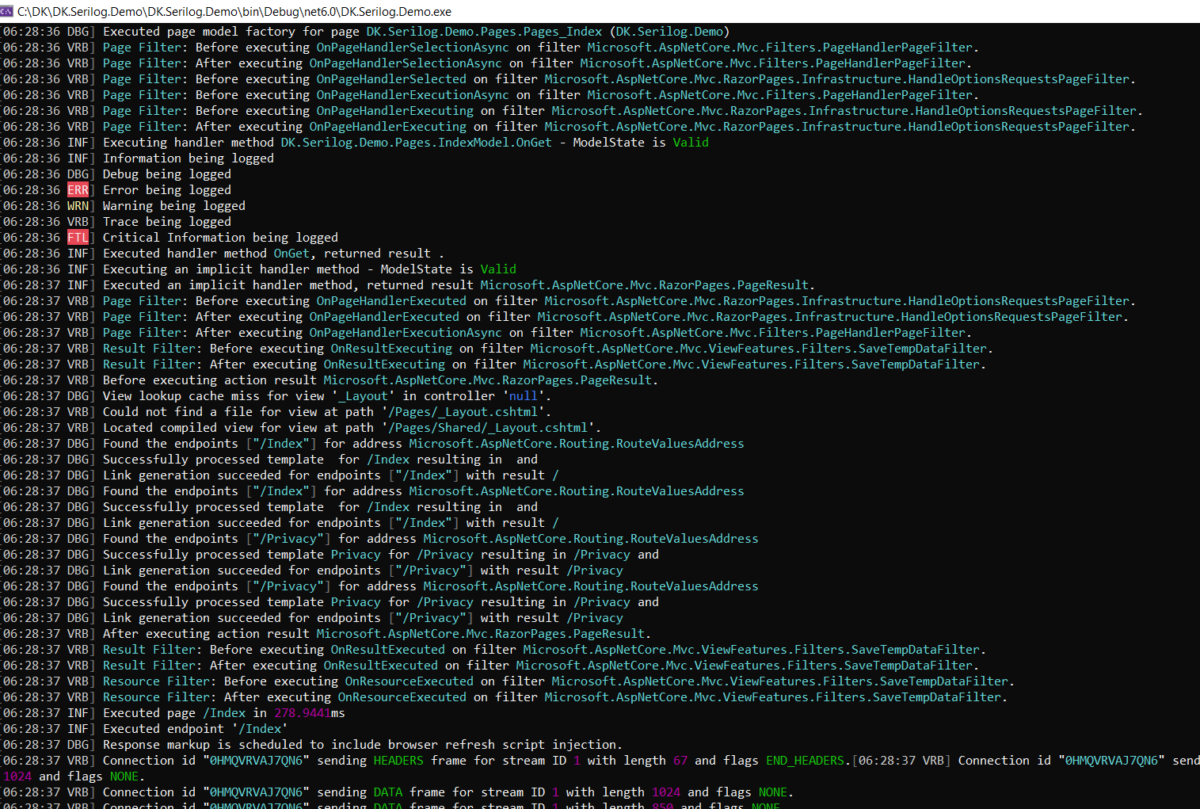
This is what the log messages of verbose look like. This is one of the nicest log levels, where all the messages will be displayed.
Choosing the appropriate log level for production environments is crucial to balance the level of detail in your logs and the performance impact it may have.
Sinks and Extensions
Serilog provides a flexible and extensible logging framework that allows you to log into different targets or sinks. You can log in to various destinations such as the console, files, databases, and more.
Here are the top 10 popular sink libraries and their targets.
- Serilog.Sinks.Console: Logs to the console output.
- Serilog.Sinks.File: Logs to one or more text files.
- Serilog.Sinks.RollingFile: Logs to rolling text files, creating a new file based on size or time intervals.
- Serilog.Sinks.Seq: Logs to a Seq server, which provides centralized log storage, search, and analysis capabilities. Follow Step by Step Guide to log data to Seq Server.
- Serilog.Sinks.ApplicationInsights: Logs to Azure Application Insights, a service that offers advanced logging, monitoring, and analytics for applications hosted in Azure.
- Serilog.Sinks.Elasticsearch: Logs to Elasticsearch, a distributed search and analytics engine, which can be useful for log aggregation and analysis.
- Serilog.Sinks.MSSqlServer: Logs to Microsoft SQL Server, storing log events in a SQL database table. Follow Step by Step Guide to log data to MSSQL Server.
- Serilog.Sinks.EventLog: Logs to the Windows Event Log, allowing you to view and manage logs using the Event Viewer.
- Serilog.Sinks.Debug Logs to the debugger output window.
- Serilog.Sinks.SignalR: Logs to a SignalR hub, enabling real-time log streaming to connected clients.
Each sink has its own set of configuration options that allow you to customize the log output and behavior according to your requirements.
Let’s explore each one of them in detail with examples.
Write Logs to the Console Using Serilog.Sinks.Console
A frequent use case when developing or troubleshooting an application is logging into the console. You may easily view log messages in the terminal window thanks to it.
Till now in all the examples we were using the console as a destination for logging the details. So I don’t think we need to revise that again.
Write Logs to Text Files Using Serilog.Sinks.File
One of the disadvantages of console logging is, it is volatile. As soon as you close the application entire logs will be gone.
The Serilog.Sinks.File sink is commonly used when you want to log messages to one or more text files. Logging to a file is beneficial for long-term storage, offline analysis, and auditing purposes.
Let’s extend our demo app and try to save logs into the text files. We can achieve that by just installing a few packages and updating the applicationsetting.json file.
We need to install an additional Nuget package called Serilog.Sinks.File to our application to make it work with the file.

Serilog.Sinks.File NugetSerilog.Sinks.RollingFile is deprecated and no need to install it separately. The same functionality has been added to the Serilog.Sinks.File package.
Update the applicationsettings.json to log data into the text files.
{
  "AllowedHosts": "*",
  "Serilog": {
    "MinimumLevel": {
      "Default": "Information",
      "Override": {
        "DK.Serilog.Demo.Services": "Warning",
        "Microsoft.AspnNetCore": "Warning"
      }
    },
    "WriteTo": [
      {
        "Name": "Console"
      },
      {
        "Name": "File",
        "Args": {
          "path": "log.txt",
          "rollingInterval": "Day"
        }
      }
    ]
  }
}
We have added an additional section in the app settings inside the Writeto section. Which will be used to configure the logging of data in other files.
Let’s run the application and look for log files in the current project directory in our case it will be inside the DK.Serilog.Demo folder.
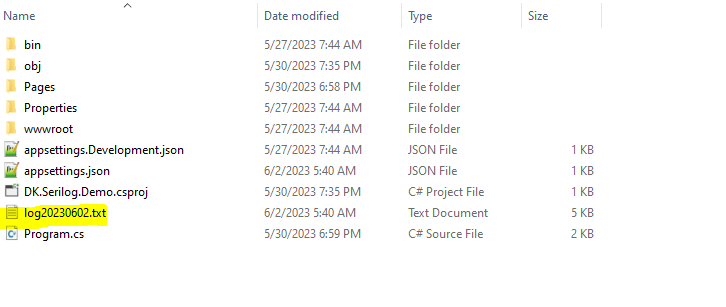
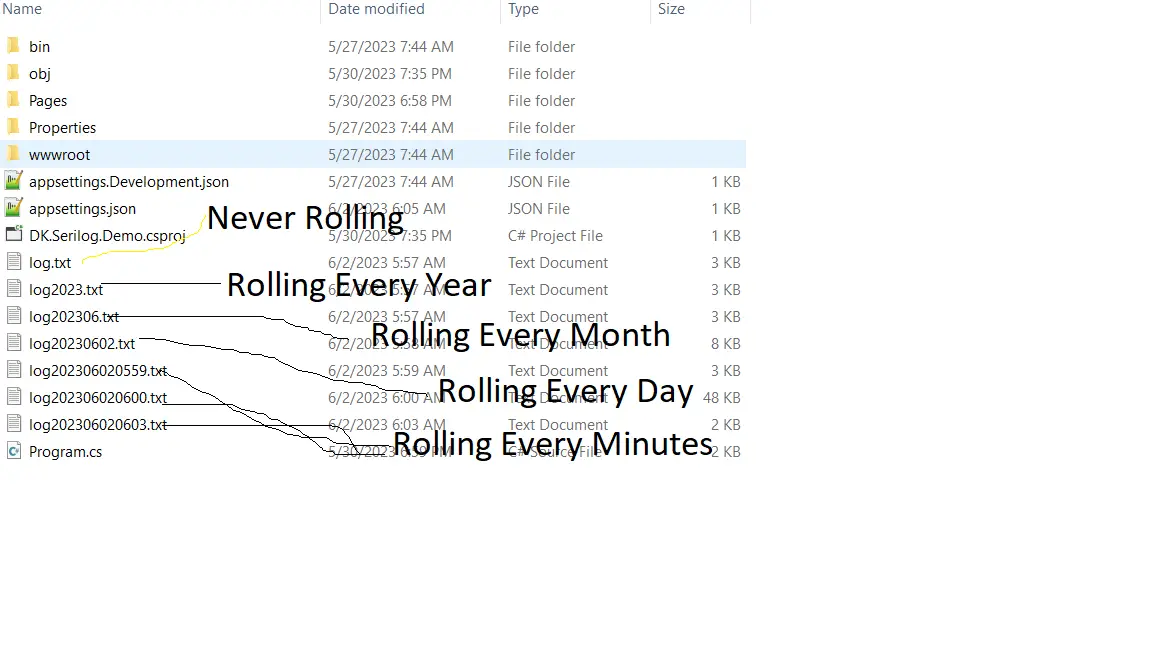
A log file with the naming convention based on the rolling Interval has been generated. In our case it is day. So file name has the date after the actual filename log.
So in this case, a new file will be generated every day to log the data.
Rolling Intervals
The rollingInterval option in Seri log’s WriteTo.File sink allows you to configure the rolling interval for log files. It determines when a new log file should be created based on the specified time duration. The rollingInterval option accepts the following values:
Infinite: This means that log files will never roll over based on time intervals.Year: Log files will roll over at the start of each year.Month: Log files will roll over at the start of each month.Day: Log files will roll over at the start of each day.Hour: Log files will roll over at the start of each hour.Minute: Log files will roll over at the start of each minute.
We tried generating log files for each of the options provided in rolling intervals and this is how it looks like in the folder.
Output Templates
In Serilog, an output template is used to define the format of log events when they are written to a sink. It allows you to customize the structure and content of log messages by specifying placeholders for various properties of the log event. These placeholders are replaced with the actual values at runtime. Here are some commonly used placeholders in an output template:
{Timestamp}: The timestamp of the log event.{Level}: The log level (e.g., Information, Warning, Error).{Message}: The message associated with the log event.{Exception}: The exception associated with the log event, if any.{NewLine}: Inserts a new line character.
You can customize the output template based on your preferences and requirements. The output template allows you to format the log events in a way that suits your logging needs and integrates well with downstream log processing tools or systems.
{
  "AllowedHosts": "*",
  "Serilog": {
    "MinimumLevel": {
      "Default": "Information",
      "Override": {
        "DK.Serilog.Demo.Services": "Warning",
        "Microsoft.AspnNetCore": "Warning"
      }
    },
    "WriteTo": [
      {
        "Name": "Console"
      },
      {
        "Name": "File",
        "Args": {
          "path": "log.txt",
          "rollingInterval": "Minute",
          "outputTemplate": "{Timestamp:yyyy-MM-dd HH:mm:ss.fff} [{Level}] {Message}{NewLine}{Exception}"
        }
      }
    ]
  }
}
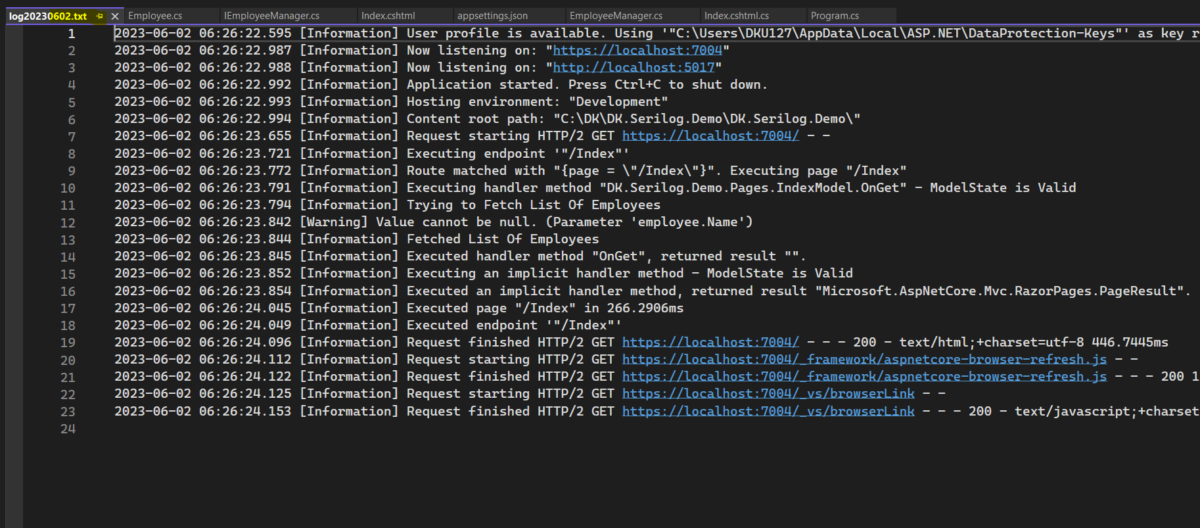
In the example above, the output template for console logging includes the timestamp in the format yyyy-MM-dd HH:mm:ss.fff, the log level, the log message, a new line, and the exception if present.
Run the application and check the logged messages inside the text file.
Formatter
In Serilog, a formatter is responsible for converting a log event into its final textual representation before it is written to a sink.
The formatter determines how the log event properties are serialized and formatted. Serilog provides various built-in formatters, and you can also create custom formatters by implementing the ITextFormatter interface.
MessageTemplateTextFormatter: This is the default formatter used by Serilog. It formats the log events using the message template specified in the log event. The output includes the timestamp, log level, message, and exception details.
JsonFormatter: This formatter serializes the log events in JSON format. Each log event is represented as a JSON object with properties such as timestamp, log level, message, and exception.
CompactJsonFormatter: Similar to the JsonFormatter, this formatter produces log events in a compact JSON format, reducing unnecessary white space.
RenderedCompactJsonFormatter: This formatter is similar to the CompactJsonFormatter, but it includes the rendered message template and properties in the output.
We need to install the Serilog.Formatting.Compact.Reader to support the CompactJsonFormatter.
  "WriteTo": [
      {
        "Name": "Console"
      },
      {
        "Name": "File",
        "Args": {
          "path": "log.txt",
          "rollingInterval": "Day",
          //"outputTemplate": "{Timestamp:yyyy-MM-dd HH:mm:ss.fff} [{Level}] {Message}{NewLine}{Exception}",
          "formatter": "Serilog.Formatting.Compact.RenderedCompactJsonFormatter, Serilog.Formatting.Compact"
        }
      }
    ]
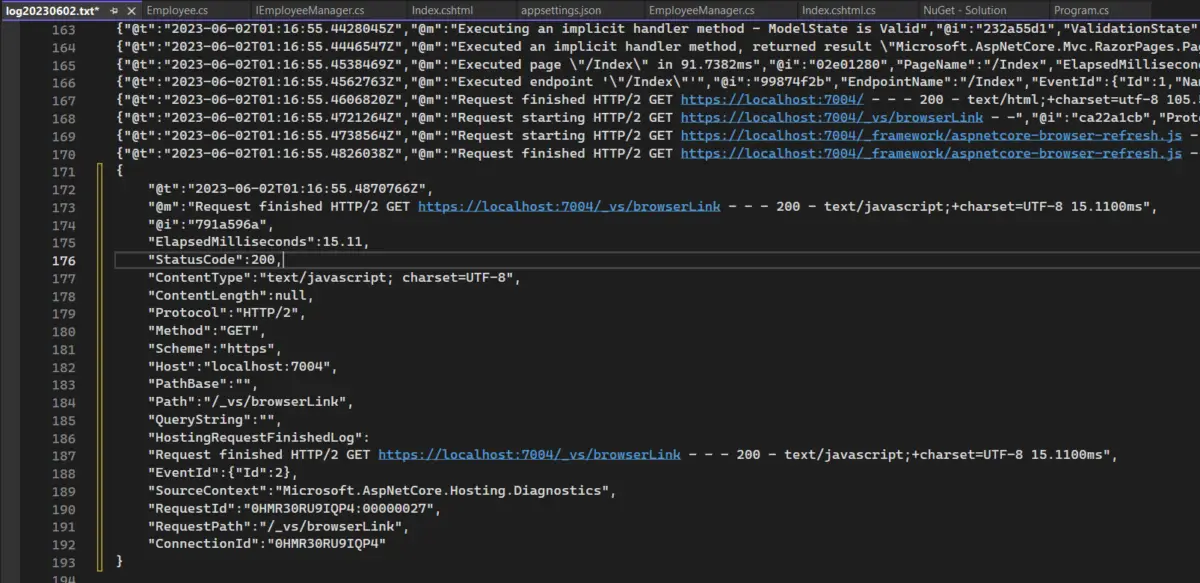
Make changes in appsetting json file to support the formatting. In the example above, the formatter property is set to "Serilog.Formatting.Compact.RenderedCompactJsonFormatter, Serilog.Formatting.Compact". This specifies the RenderedCompactJsonFormatter from the Serilog.Formatting.Compact namespace as the formatter for the console sink.
Run the application again and check the output log file. As we see it has output messages in json format.
How to Configure Custom Formatter in Serilog
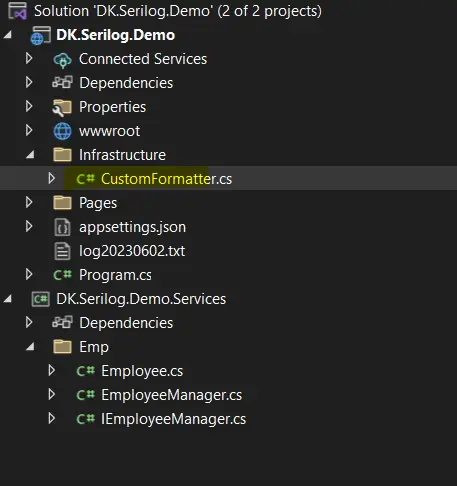
To create a custom formatter in Serilog, you need to implement the ITextFormatter interface. This interface has a single method called Format, which takes LogEvent and writes the formatted log event to a TextWriter.
Let’s Create a new class inside the infrastructure folder in the root directory.
using Serilog.Events;
using Serilog.Formatting;

namespace DK.Serilog.Demo.Infrastructure
{
    public class CustomFormatter:ITextFormatter
    {
        public void Format(LogEvent logEvent, TextWriter output)
        {
            // Format the log event as per your custom logic
            string formattedLog =
                $"{logEvent.Timestamp:yyyy-MM-dd HH:mm:ss} [{logEvent.Level}] {logEvent.Properties["Message"]}{Environment.NewLine}";

            // Write the formatted log event to the output
            output.Write(formattedLog);
        }
    }
}
To configure the custom formatter we need to specify the namespace along with the full name of the class.
{
  "Serilog": {
    "MinimumLevel": {
      "Default": "Information",
      "Override": {
        "DK.Serilog.Demo.Services": "Warning",
        "Microsoft.AspnNetCore": "Warning"
      }
    },
    "WriteTo": [
      {
        "Name": "Console"
      },
      {
        "Name": "File",
        "Args": {
          "path": "log.txt",
          "rollingInterval": "Day",
          //"outputTemplate": "{Timestamp:yyyy-MM-dd HH:mm:ss.fff} [{Level}] {Message}{NewLine}{Exception}",
          "formatter": "DK.Serilog.Demo.Infrastructure.CustomFormatter, DK.Serilog.Demo"
        }
      }
    ]
  }
}
In this example “DK.Serilog.Demo" is the namespace and "DK.Serilog.Demo.Infrastructure.CustomFormatter" is the actual implementation class that implements the ITextFormatter.
We can run the application and check if the debug point is hit to validate the CustomFormatter implementation.
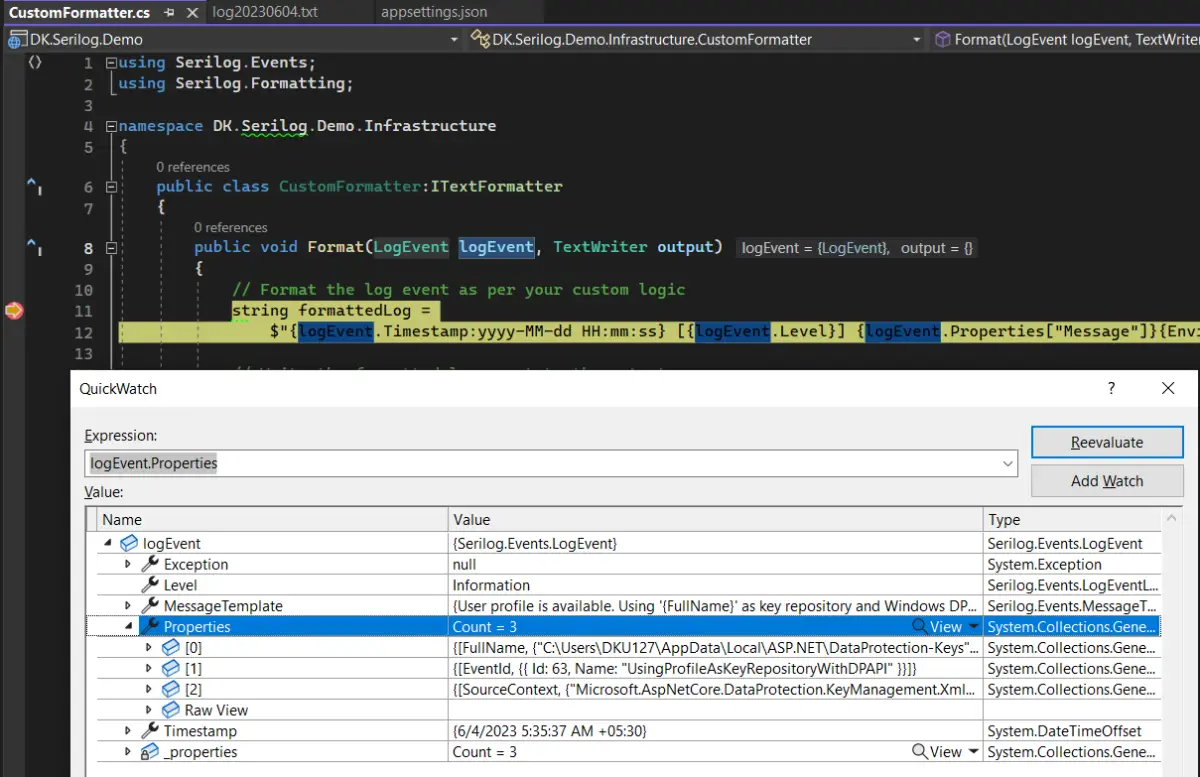
As we see the debug point is hit and we can validate the properties available in the LogEvent object and format the message as per requirement.
And, this is the output format which we will see on the application has some logs.

Advanced Logging Techniques
Utilizing advanced logging techniques can greatly improve the effectiveness and efficiency of your logging solution.
Log CorrelationIds
In distributed systems or microservices architectures, it can be challenging to trace a specific request or transaction across multiple services.
Log correlation techniques allow you to track a request’s journey through different components by including a unique correlation ID in each log entry.
This correlation ID can be propagated across service boundaries, enabling easy tracing and understanding of the end-to-end flow.
Performance Logging
In addition to capturing errors and exceptions, logging performance-related information can help identify bottlenecks and optimize your application.
By measuring and logging critical metrics such as response times, database query durations, or CPU/memory usage, you can gain insights into the performance characteristics of your application and pinpoint areas that require optimization.
Log Filtering
Applying filters to log events allows you to control which log entries are captured based on specific criteria.
You can filter logs based on severity levels, log event properties, or custom conditions. Filtering can help reduce log noise, focus on relevant events, and optimize the amount of data stored or transmitted.
As we have already seen in the above section. How to avoid logging from frameworks classes.
Log Retention Policy
Determining how long to retain logs and when to archive them is crucial for compliance, auditing, and troubleshooting purposes.
Consider implementing a log retention policy that defines the lifespan of log entries based on their importance or regulatory requirements. Archiving logs can involve transferring them to long-term storage for future reference or analysis.
Let’s assume we don’t have any compliance and auditing in place for the logs retention policy. We can simply add the configuration to delete the files older than some timespan.
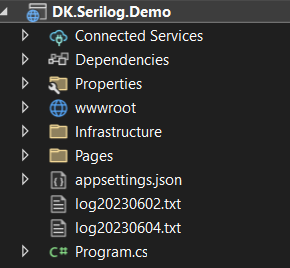
As we see in the above image, our demo app has generated two files. One is on 20230602.txt and the other is on 20230604.txt. because the rolling interval we provided for the file sink was every day.
As an when the time goes these log files will keep pilling up here in the provided path. In order to remove the old log files which are no more useful then.
We need to just update the retainedFileCountLimit property in our json config.
  "WriteTo": [
      {
        "Name": "Console"
      },
      {
        "Name": "File",
        "Args": {
          "path": "log.txt",
          "rollingInterval": "Day",
          "formatter": "Serilog.Formatting.Compact.RenderedCompactJsonFormatter, Serilog.Formatting.Compact",
            "retainedFileCountLimit":1,
        }
      }
    ]
If I will run the application again, it will delete the older files and will generate a new file for today’s log.
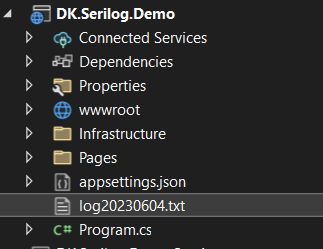
As we see the log file which was generated 20230602.txt has been deleted.
Contextual Logging
Enriching log events with contextual information can enhance the understanding and analysis of log entries. This includes capturing user details, request or session identifiers, geographic location, or any other relevant contextual data.
By including contextual information, you can gain better insights into the specific conditions or circumstances surrounding a log event.
Event Batching and Buffering
Log event batching and buffering are techniques used to optimize the logging process by reducing the number of I/O operations and improving overall logging performance.
These techniques involve collecting multiple log events and sending them in batches or buffering them before writing to the log output.
Configure Event Batching In AppSettings.Json
Serilog provides mechanisms to implement batching and buffering. In order to log events in batches we need to configure the DurableTasksecion in appsetting.json file.
{
  "Serilog": {
    "MinimumLevel": {
      "Default": "Information",
      "Override": {
        "DK.Serilog.Demo.Services": "Warning",
        "Microsoft.AspnNetCore": "Warning"
      }
    },
    "WriteTo": [
      {
        "Name": "Console",
        "Args": {
          "formatter": "DK.Serilog.Demo.Infrastructure.CustomFormatter, DK.Serilog.Demo"
        }
      },
      {
        "Name": "File",
        "Args": {
          "path": "log.txt",
          "rollingInterval": "Day",
          "outputTemplate": "{Timestamp:yyyy-MM-dd HH:mm:ss.fff} [{Level}] {Message}{NewLine}{Exception}",
          "formatter": "DK.Serilog.Demo.Infrastructure.CustomFormatter, DK.Serilog.Demo",
          "retainedFileCountLimit": 1
        }
      }
    ],
    "DurableTask": {
      "BatchSizeLimit": 800,
      "QueueLimit": 5000,
      "Period": "00:00:02",
      "BackgroundQueueSize": 800
    }
  }
}
- BatchSizeLimit: Specifies the maximum number of log events to include in a batch. Once this limit is reached, the batch is sent for processing. In the example, the limit is set to 800, meaning that once 800 log events have been accumulated, they will be processed as a batch.
- QueueLimit: Defines the maximum number of batches that can be held in the queue before they are processed. If the queue limit is reached, additional log events will be dropped until there is space in the queue. This setting helps prevent memory overflow when log events are generated faster than they can be processed.
- Period: Specifies the time interval for processing log event batches. In the example, the period is set to 2 seconds (00:00:02). This means that every 2 seconds, or at the end of the period, any accumulated log event batches will be sent for processing.
- BackgroundQueueSize: Determines the maximum number of batches that can be held in the background queue. This queue is used to buffer log events while they are being processed. If the background queue size limit is reached, new log events will be dropped until there is space in the queue.
By configuring these settings, you can control the size of log event batches, the rate at which they are processed, and the buffering behavior to optimize performance and ensure log event integrity. Adjust the values based on your application’s logging requirements and the available system resources.
Configure Buffering In AppSettings.Json
Let’s extend the configuration of file Sink which we implemented earlier in this example. And, add a few more configurations.
To achieve buffering we need to include two additional properties buffered and flushToDiskInterval.
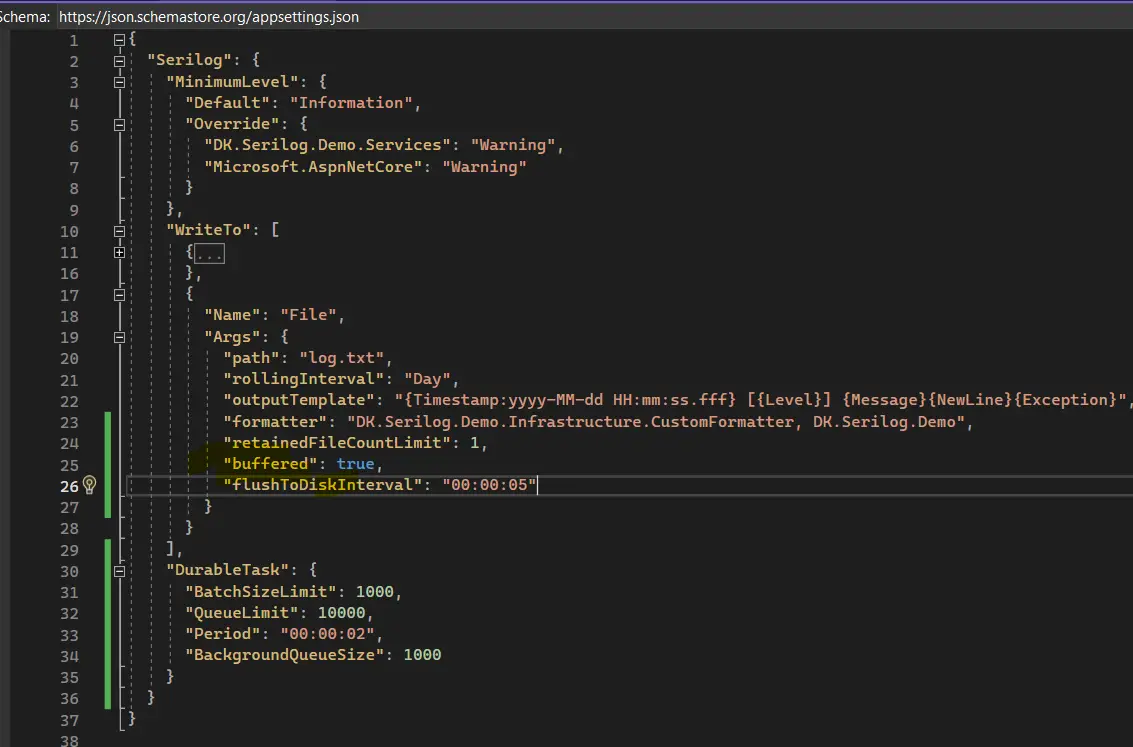
We included the "buffered": true setting to enable log event buffering.
The "flushToDiskInterval": "00:00:05" specifies that the log events will be flushed to the disk every 5 seconds. You can adjust the interval as per your requirements.
Performance and Scalability
Performance and scalability are important considerations when implementing logging in an application.
Efficient logging can help minimize the impact on system resources and ensure the application can handle increased log volume without degrading performance.
Log Level Filtering
Configure the minimum log level to only capture the necessary information. Avoid logging unnecessary verbose or debug-level messages in production environments, as they can generate a high volume of logs.
When you need different logging needs for certain components of your application, you can utilize application settings to override log levels in Serilog.
Take a look at a web application that has several namespaces or modules, such as authentication, data access, and business logic. Depending on the level of importance or level of detail needed for troubleshooting, each module may have various logging requirements.
You can simply configure multiple log levels for each module without changing the code by overriding log levels in the application settings.
Consider the following scenario:
- The authentication module is critical, and you want to log all events at the Debug level.
- The data access module is less critical, and you want to log events at the Information level.
- The business logic module is moderately critical, and you want to log events at the Warning level.
Let’s understand this with an example. We can extend the demo project to have one more layer with different log-level requirements.
After adding them DK.Serilog.Demo.Services to the solution, this is what it looks like.

And, lets move the IEmployess interface and class inside this project. The service layer will have the logic to do some business validations and information for debugging purposes.
using Microsoft.Extensions.Logging;

namespace DK.Serilog.Demo.Services.Emp;

public class EmployeeManager:IEmployeeManager
{
    private readonly ILogger<IEmployeeManager> _logger;

    public EmployeeManager(ILogger<IEmployeeManager> logger)
    {
        _logger = logger;

    }

    private static readonly IList<Employee> Employees = new List<Employee>();

    public void AddEmployee(Employee employee)
    {
        try
        {
            _logger.LogInformation("Trying to add Employee");
            _logger.LogDebug($"Adding Employee With Id{employee.Id} and Name{employee.Name}");
            ArgumentNullException.ThrowIfNull(employee.Name);
            Employees.Add(employee);
            _logger.LogInformation("Employee Added Successfully");
        }
        catch (Exception e)
        {
            _logger.LogWarning(e.Message);
            throw;
        }
    }

    public List<Employee> GetEmployeeNames()
    {
        if (!Employees.Any())
        {
            Employees.Add(new Employee() { Id = 1, Name = "Owner" });
        }

        return Employees.ToList();
    }
}
As we see in the above class, there are three levels of logging where we are logging the data. One is information that is used to log the information about the method being invoked and completed.
The second one is the Debug information, Which is used for logging the data being sent to add employees. It can be used while debugging the application and validating the inputs.
The third one is wherever there is a validation failure or any exception during the employee creation. It will log the warning message.
Let’s run the application and see the console, and what the logs look like.

As we see in the above output window.Its logs Information and Debug both types of messages.
But, as per our requirement, we want to show only the warning messages from the Service layer. To do that let’s update the applicationsettings.json file.
{
  "AllowedHosts": "*",
  "Serilog": {
    "MinimumLevel": {
      "Default": "Debug",
      "Override": {
        "DK.Serilog.Demo.Services": "Warning",
        "Microsoft": "Warning"
      }
    },
    "WriteTo": [
      {
        "Name": "Console"

      }
    ]
  }

}
As we see in the configuration file. We are overriding the Log level only for the namespace DK.Serilog.Demo.Services. So anything which is logged under this namespace will only show the warning messages ignoring other types of logs.
Also if you have observed the previous output screen. We are getting a lot of information related to the framework. And, also we are filtering by adding Microsoft.AspnNetCore to the overridden list.
By doing this we can avoid the notice and just get the useful information.
Run the application again and see the console output.

As you can see in the above screenshot, the Log information which was in the last screenshot is disappeared now because of the restriction we have added at the namespace level.
Asynchronous Logging
Use Serilog’s asynchronous logging capabilities to offload the logging operations to separate threads or tasks.
Asynchronous logging reduces the impact on the main application thread, improving overall performance and responsiveness.
Performance Testing and Tuning
Benchmark and profile your logging implementation to identify potential bottlenecks or areas for optimization.
Monitor system resource usages, such as CPU and disk I/O, during high-load scenarios to ensure logging operations do not adversely impact application performance.
Infrastructure Scaling
Ensure your logging infrastructure is scalable to handle increased log volumes. Consider load balancing and distributing logs across multiple servers or log storage systems to accommodate growing log data.
Distributed Logging
Consider distributed logging architectures for large-scale applications or microservices. Use centralized log aggregation tools or services that can handle high log volumes and provide efficient querying and analysis capabilities.
Designing effective log schemas
Using naming standards for log events can help your logs be more consistent and clear, which makes them simpler to read and analyze.
While there are no strict rules for naming log events, here are some common conventions and best practices:
- Use Descriptive Names: Choose meaningful and descriptive names for your log events. The name should reflect the action or event being logged. For example, instead of simply logging “Info” or “Error,” use names like “UserRegistrationSuccessful” or “PaymentProcessingFailed” to provide more context.
- Use Verb-Noun Format: Follow a consistent format where the name starts with a verb followed by a noun. For example, “CreateOrder,” “UpdateCustomer,” or “ProcessPayment.” This format helps convey the action being performed.
- Avoid Abbreviations and Acronyms: Use full words instead of abbreviations or acronyms to ensure clarity. Abbreviations can be ambiguous and may not be immediately understandable to all readers of the logs.
- Be Consistent: Maintain consistency in naming conventions throughout your codebase. This makes it easier to search and analyze log events across different components or modules of your application.
- Use Camel Case or Pascal Case: Choose a casing convention and stick to it. Common conventions include camel case (e.g., “processPayment,” “userLogin”) or Pascal case (e.g., “ProcessPayment,” “UserLogin”). Using consistent casing makes log event names more readable.
- Include Relevant Information: Include additional information in the log event name, such as unique identifiers, error codes, or specific context details. This can help identify and correlate related log events more easily during troubleshooting.
- Avoid Overly Long Names: While descriptive names are important, avoid excessively long log event names. Long names can be cumbersome and make log entries harder to read. Aim for a balance between clarity and brevity.
- Consider Logging Hierarchy: If your logging framework supports hierarchical log events or log categories, consider using a hierarchical structure in your naming conventions. This can help organize and group related log events under a common parent category.
Remember, the primary goal of log event naming conventions is to make your logs more understandable and meaningful.
Choose conventions that align with your application’s domain, maintain consistency, and provide sufficient context for troubleshooting and analysis.
Conclusion
logging is a crucial aspect of software development and maintenance. It allows you to capture important information about the behavior and state of your application, aiding in troubleshooting, monitoring, and understanding user interactions.
Throughout this comprehensive guide, we have covered various aspects of Serilog, including its basic concepts, setup and configuration, log event handling, integration with popular logging frameworks, exploration of third-party extensions, advanced logging techniques, and considerations for performance, scalability, and different environments.
Logging is an ongoing process, and it’s important to continuously review and refine your logging practices as your application evolves.
Regularly analyze and monitor your logs to gain valuable insights, identify patterns, and make informed decisions for improving your application’s performance, stability, and user experience.


Comments are closed.